Tag Archives: openlayers

Networks, Geography, and Gephi: Lots of Promise, but Lots of Work to be Done

This post will outline some of my efforts to bring social networks into dialog with geography. Although I have found some interesting plugins and hacks, the results still leave something to be desired.


Screen Shot 2015-10-07 at 1.40.46 PM
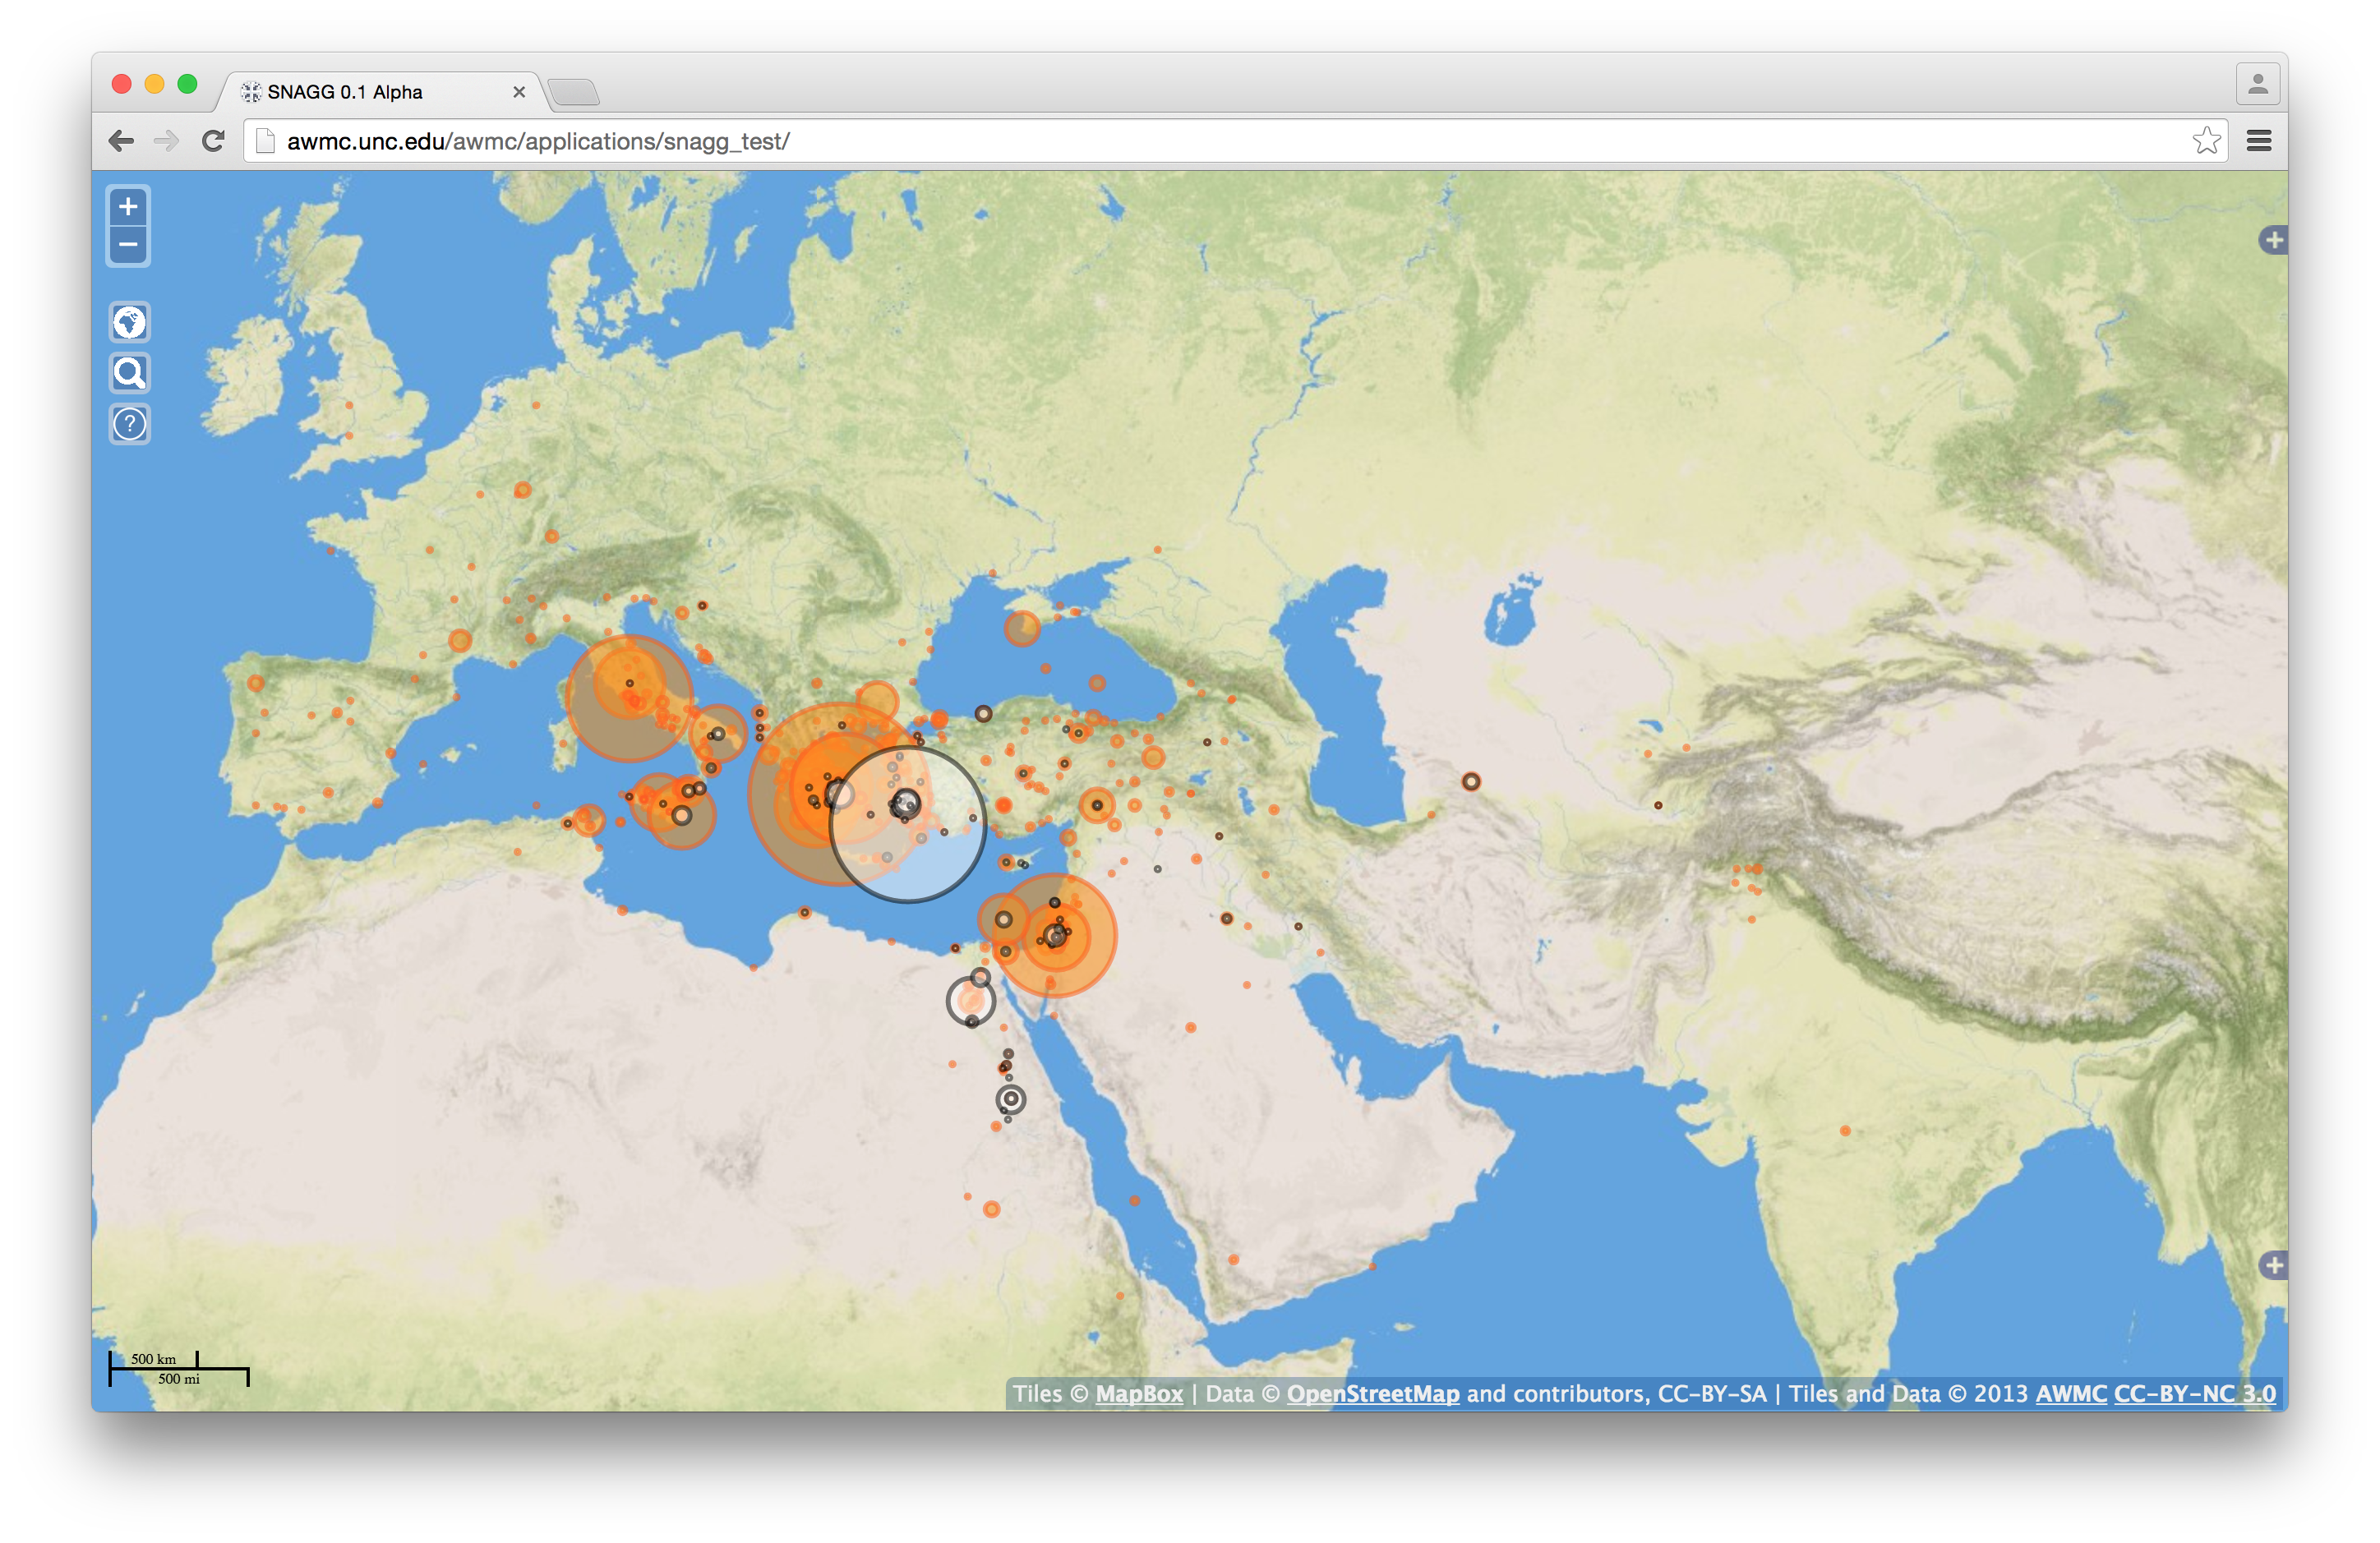
To provide some background: From my dissertation I have a nice, interactive map of all garrisons (phrourai, in orange), and garrison commanders (phrourarchoi, in white) from all of Greek sources up to the mid second century C.E. This is all nicely georeferenced, linked to other projects such as Pleiades and Pelagios, and serves its purpose pretty well. However, this provides the location and frequency of garrisons and commanders, and does not really show the social network that developed between commanders, monarchs, and communities. I could perhaps use a clustering strategy to create dynamic markers around specific points, but that seems to be a very unwieldy solution.

Strictly speaking, by modeling people (phrourarchoi, monarchs) with places and abstract communities I am moving beyond a social network and instead looking at an information network, as I am interested in a number of different connections (social, geographic, ideological) that are not traditionally associated with social network analysis.

The first step to get all of my data into Gephi, assign different “types” to my nodes (in my case people, offices, places, phrourarchoi). I then created a network map, ran statistics, assigned the node size based on degree, and ran a force atlas layout. At the same time I also color coded the network based on type. This is all pretty basic Gephi use so far, and produced a perfectly serviceable network graph.

degree
First graph. Pretty basic and serviceable.

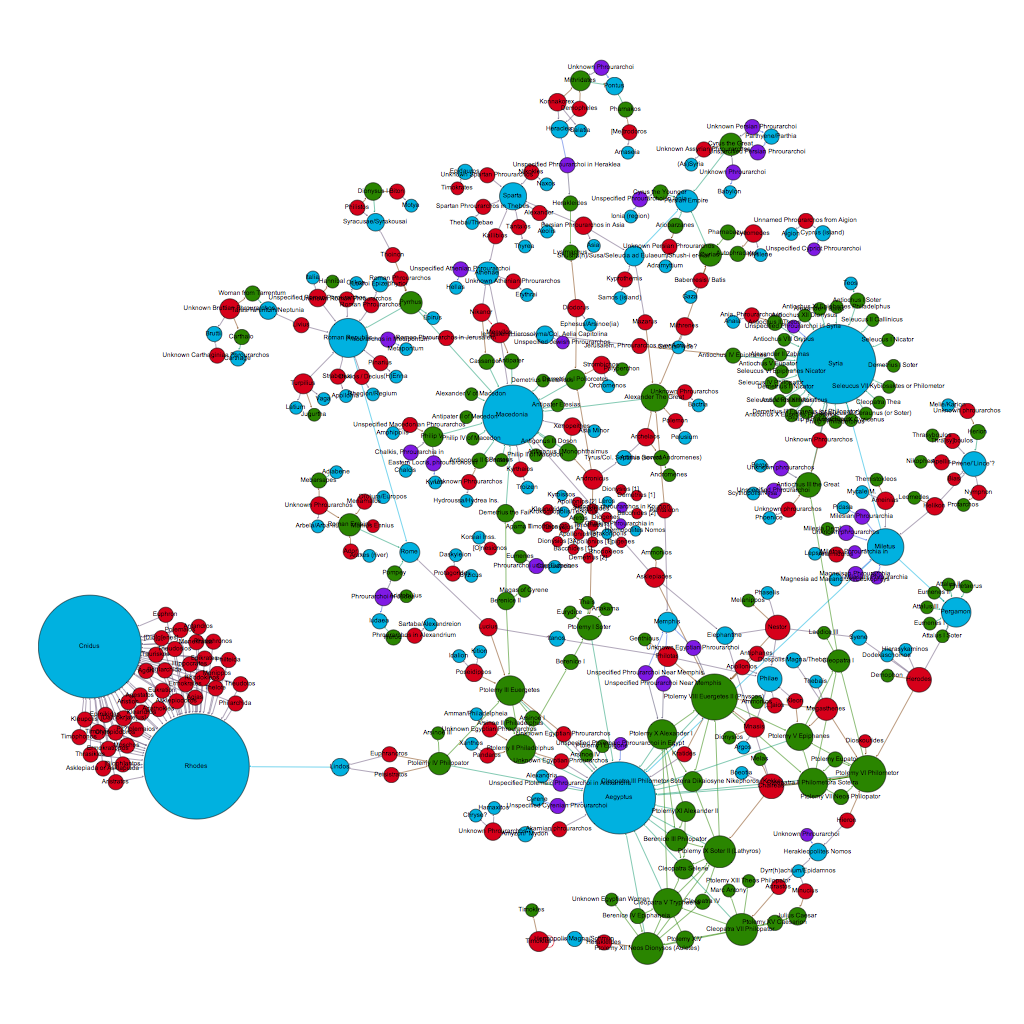
Now it was time to experiment with different types of ranking. Betweenness centrality, or the measure of a node’s influence, led to an interesting difference in graphs:

Untitled
Betweenness Graph. Note the increased importance of individuals.

However, this result is somewhat meaningless, as my graph covers a period from the 400s BCE to the 100s CE. Despite any of his wishes to the contrary, Ptolemy VIII did not live forever, yet he is the unquestioned central authority of this graph. All of the other Egyptian monarchs also score highly, underlining their importance in the communications and relationships between different phrourarchoi. This is an interesting yet hardly unsurprising finding – a good portion of the surviving data on phroruarchoi originates from Ptolemaic Egypt, which may inflate the relative importance of the dynasty in this kind of analysis. What this map does show is the enormous influence of individuals – most of whom were not phrourarchoi themselves.

However, I am interested in garrisons as a sustained phenomena across several centuries, so I want to get back to the importance of location and geography on garrisons. In other words: Where are the most important locations for phrourarchoi, and how do those relate to one another?

Running an Eigenvector Centrality measurement produces a graph that somewhat mimics my original map, with physical locations, not people as the most significant authorities. This gives a better impression of what I am looking for – the centrality of a node relative to the whole network, which in my case privileges locations, which often serve as a bridge between different populations of nodes.

egienvector
Eigenvector Centrality

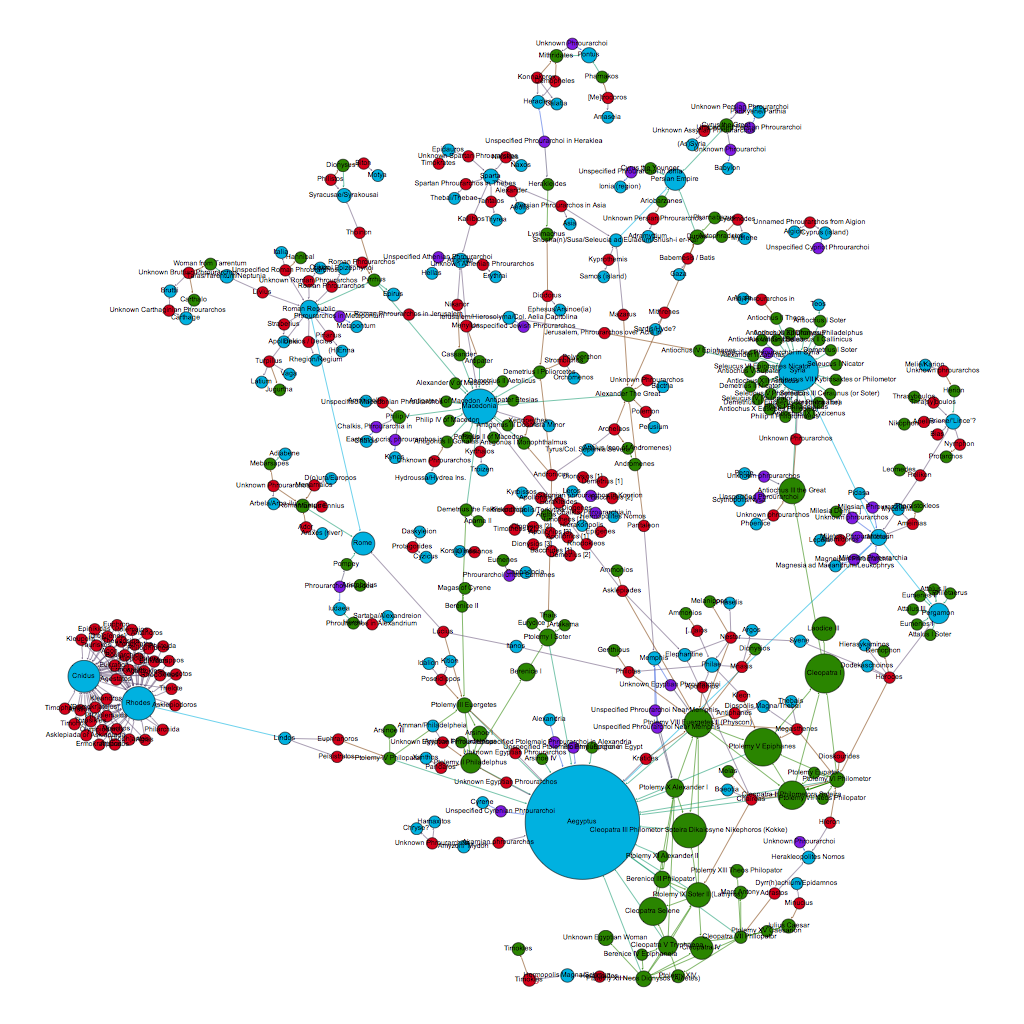
To me this is an interesting graph: It shows the importance of locations, while still highlighting important individuals. Now that I have this graph, I would love to place it on a map. I actually have coordinates for all of the locations, so a simple use of the Gephi GeoLayout plugin puts all of my identified places in a rough geographic layout.

Screen Shot 2015-10-07 at 12.48.40 PM

From here I simply fixed the location of the places, then ran some other layouts to try and make a coherent graph of people and offices that did not have a specific geographic value.The results were generally less than satisfying. The individuals in my dataset are not assigned coordinates because it would make little sense to do so – some phroruarchoi served in multiple locations, and almost all imperial phrourarchoi served outside their place of origin, were buried somewhere else, possibly lived in yet another location, etc.

geo
Force Atlas combined with GeoLayout
circle
Force atlas and Fruchterman-Reingold
geo-attempr
Adjusting the size of the nodes and running force atlas eventually produced  a result that looks more comprehensible, if a bit small.

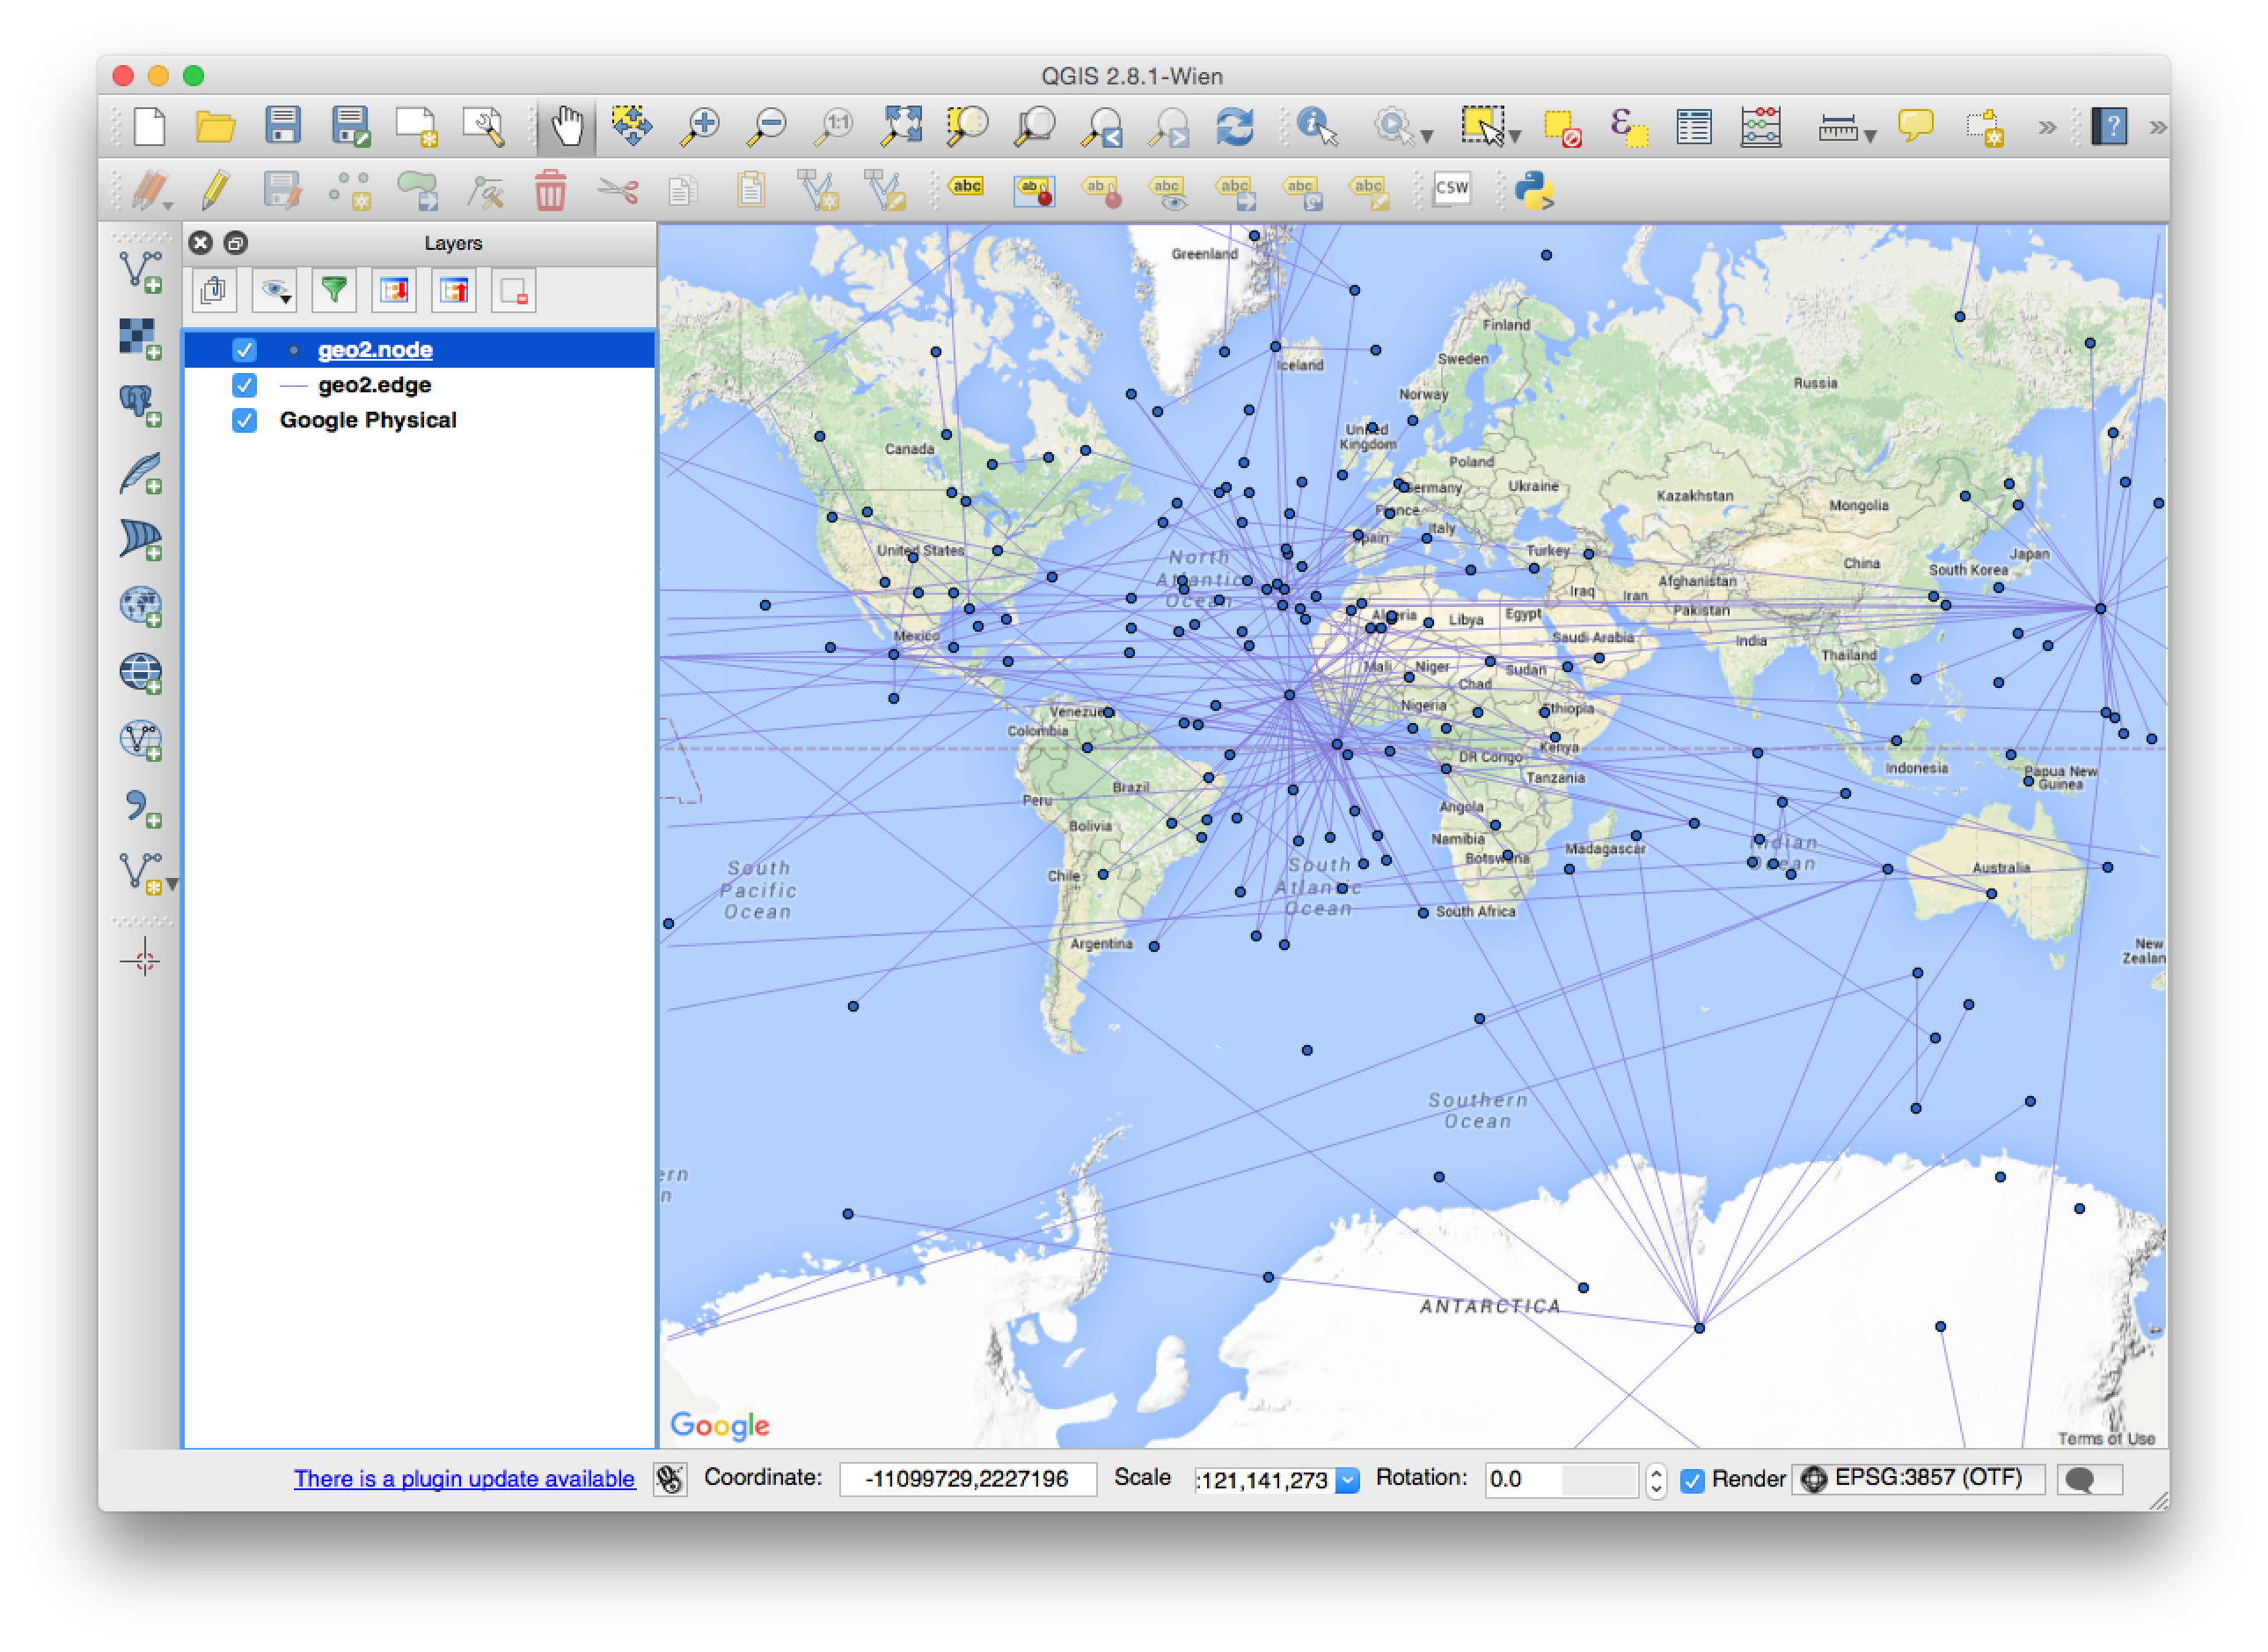
From this step, I thought I would try out some Gephi plugins to push my data into a format I could drop onto a map. Only a very small percentage of my nodes actually contain geographic information, so the ExportToEarth plugin was not going to help. My first attempt at pushing out a shapefile using Export to SHP initially looked like a success in QGIS:

Screen Shot 2015-10-07 at 1.43.16 PM
This looks promising…

So, I decided to throw in some background, and that is when the trouble started. QGIS does a good job of transforming coordinates, but this was just messy (and not to mention wrong – there certainly were no phrourarchoi in Antarctica!)

Screen Shot 2015-10-07 at 1.35.59 PM
Note how the nodes are now literally all over the map.

So, what happened? If you do not have coordinates already explicitly assigned to your data, Export to SHP actually does not use “geographic” coordinates, and instead uses, in the words of the plugin, “fake geography – that is the current position of the nodes in the Gephi layout”. My thought that this position would line up with correct coordinates fromGeoLayout were false –Export to SHP treats the middle of the map as an origin point (instead of using whatever geographic data is present), and as such it does not match with any projection in QGIS.

This is a bit of a let down. It seems that all of mapping plugins in Gephi need for *ALL* of the nodes to have geographic information already baked in, or they will not export a geographically accurate map. This does make some sense, but it would be nice if you could use GeoLayout to place nodes with actual geographic data, then use force atlas or some other layout to produce a graph, and finally use the location of those nodes as coordinates. In other words, the location of nodes on the graph that have no actual geographic data of their own are located relative to nodes that do have geographic data. I tried the Sigmajs exporter, but the json object also does not use real coordinates, as seen in the fragment below ( lng and lat are the real-world coordinates, while x and are used by SigmaJS):


"label":"Priene/‘Lince’?",
"x":-22.65546226501465,
"y":32.66741943359375,
"id":"Pl_599905",
"attributes":{
...
"lng":"27.297566084106442",
"lat":"37.659724652604169",
...},

So, is there a way around this?

Short of writing a new plugin to do so, it looks like Gephi is simply missing the functionality of assigning geographic points to nodes that do not already have that information, then exporting that graph in a way that makes sense to mapping software. I could export an image and georeference that, but that will not provide the functionality I am looking for either.

What I would like is for a graph produced by Gephi to use coordinates for nodes that have them, and make real world coordinates for nodes that do not. This map could then be placed on Leaflet / OpenLayers / whatever map, providing a level of interaction beyond a static image. As it is impracticable to duplicate the functionality (especially the statistical tools and layouts) of Gephi in a mapping application, this strikes me as something that would be very valuable to visualization and study.

My next idea is to see if R has something close to what I want, which I will detail in a future post.

Advertisement

Code for BAM: Part 1 of N. Gephi and Maps

This is the first in a series of posts where I will be detailing some of the code and development of BAM. Some of these techniques may be old hat for some users or simple hacks, but they might be useful for anyone else who is trying to do similar work.

TBib-select
Terra Biblica with both the social network graph and map displaying information on Jesus.

In this post, I will detail how I got Gephi data (produced by the SigmaJs Exporter) to communicate with an OpenLayers 2 map. When a user clicks on any entity in the network graph the map panel will adjust to show the locations and frequency of that entity in geographic space. At the same time, any clicks on an entity name on the map (provided by a popup) will adjust the social network graph to highlight that entity. This code is built on javascript, PHP, and a PoistGIS backend. At some point in the future BAM may transition to OpenLayers 3, but for now we are sticking with 2 as it formed the basis for À-la-Carte, Digital Strabo, and other digital efforts that BAM builds upon and extends.

For a working demonstration of the final result, see http://awmc.unc.edu/awmc/applications/bam/luke/. All of the code mentioned in this post, and created for BAM, is available at: https://github.com/Big-Ancient-Mediterranean/BAM.

Step 1: Get your data in order!

Before attempting any of this, you need to ensure that the entities that you are using in Gephi and the ones you have in your database have a consistent, unique ID. So, if Andrew has an id of 1234567 in Gephi, you need to associate 1234567 with different locations, texts, etc in your database that are also related to Andrew. Failure to do so will make it VERY difficult, if not impossible, to get all of the different components to talk to each other.

Next, you actually need to build your network in Gephi and export it out. Building the network itself is beyond the scope of this post, but you need to install and familiarize yourself with the excellent SigmaJs Exporter created by Scott Hale at the Oxford Internet Institute. Essentially what we are doing is taking the output of the SigmaJs Exporter, cutting it down, and making it communicate with a dynamic, interactive map on the same webpage.

directoryAfter exporting your network using the SigmaJs Exporter, you should have a directory structure that roughly looks like the screenshot to the right. You want to upload everything but htaccess_exampleweb.config, and index.html to your webserver.

We then need to add this network to an HTML file that already has a map. In our case, we are modifying the code behind Strabo Online and SNAGG. I may detail how to create a map in another post, but there are plenty of resources online to get you going on a basic map.

We are going to mimic the functionality of the index.html file that we excluded in our own html file. First, we need to include the various javascript files and libraries used by the application:


<script src="js/jquery/jquery.min.js" type="text/javascript"></script>
<script src="js/sigma/sigma.min.js" type="text/javascript" language="javascript"></script>
<script src="js/sigma/sigma.parseJson.js" type="text/javascript" language="javascript"></script>
<script src="js/fancybox/jquery.fancybox.pack.js" type="text/javascript" language="javascript"></script>
<script src="js/main.js" type="text/javascript" language="javascript"></script>

<link rel="stylesheet" type="text/css" href="js/fancybox/jquery.fancybox.css"/>
<link rel="stylesheet" href="css/style.css" type="text/css" media="screen" />
<link rel="stylesheet" media="screen and (max-height: 770px)" href="css/tablet.css" />

Now we need to place some divs to hold the content from our social network. These can be styled at your leisure.


<div style="padding-left: 1%;padding-right: 1%;" id="socialNetContainer" class="socialNetContainer">

<div class="sigma-parent">

<div class="sigma-expand" id="sigma-canvas">

<div style="z-index:9994" id="attributepane">

<div class="text">

<div title="Close" class="left-close returntext">

<div class="c cf">
<span>Return to the full network</span>
</div>

</div>


<div class="nodeattributes">

<div class="name"></div>


<div class="data"></div>


<div class="p">Connections:</div>


<div class="link">

<ul>
</ul>

</div>

</div>

</div>

</div>

</div>

</div>

</div>


Now that we have all the functionality of the SigmaJs Exporter in our map, we need to make the components talk to each other. First, we need to identify what node is active on the sigma.js div, and use that information to select the appropriate data for our map. The function nodeActive in SigmaJs identifies what / when a node is active – so we will extend this to pass that information to a variable (for a more detailed explanation on how to extend a javascript function, see http://coreymaynard.com/blog/extending-a-javascript-function/).

We are also going to create a separate function to deal with adjusting the map itself, called tBibPersonConnections, which will be called in our new, extended function:

(function() {
//first copy the old function in the new one
 var old_nodeActive = nodeActive;

//new function with the same name as the old one - this overrides the old function
 nodeActive = function() {

//we are going to build the map from the person_id that is called from the node
// this is a separate function that will be explained below 
 tBibPersonConnections(arguments[0], tBibPeoplelayer);
 activePerson = arguments[0];

// Calls the original function\
 var result = old_nodeActive.apply(this, arguments);

// now return the result
 return result;
 }
})();

tBibPersonConnections is where the work really happens. Lets examine this function slowly.


function tBibPersonConnections(personNameChoice, tBibPeoplelayer)
{
 var dataStringForFeature ='pid=' +personNameChoice +'&amp;amp;amp;amp;amp;amp;start=0';
 tBibPeoplelayer.destroyFeatures();
 tBibfeaturesOnMap =[];

 $.ajax({
 dataType: "json",
 type:'GET',
 data:dataStringForFeature,
 url:'tbib_mapmaker.php',
 success:function(dataJson) {
 for (var i = 0; i &amp;amp;amp;amp;amp;lt; dataJson.features.length; i++){
 var untransformed_feature = geojson_format.read(dataJson, "FeatureCollection");
 //for some reason this is going into an array. Going to hardcode for now
 for (var j = 0; j &amp;amp;amp;amp;amp;lt; dataJson.features.length; j++){
 if (tBibfeaturesOnMap.indexOf(untransformed_feature[j].attributes.pid) &amp;amp;amp;amp;amp;lt; 0){
 tBibPeoplelayer.addFeatures(untransformed_feature[j]);
 tBibfeaturesOnMap.push(untransformed_feature[j].attributes.pid);
}
}
 tBibPeoplelayer.refresh({force:true}); 
 }
 },
 error: function (xhr, ajaxOptions, thrownError) {
 alert(xhr.responseText);
 }
 });

}

The function takes the ID of the person selected and layer that houses all of the feature information as arguments.

The first thing we do is create parameters for the PHP file that will return all of the place / feature information that is associated with an individual person. Do not worry about the “start” parameter for now, as it is only used when resetting the map to an initial state. The lines

tBibPeoplelayer.destroyFeatures();
tBibfeaturesOnMap =[];

first clear the map layer of all features, and then sets up an array to hold all of the new features that we will be adding to the map.

The AJAX call to tbib_mapmaker.php actually queries our database, and returns each feature that is associated with an individual, the number of times the individual is mentioned with the feature, and the geographic location of the feature. While the actual sql calls are specific to this application / database, I will show what we are doing for combining Pleiades data, BAM data, and the map:

$query = "select
pplaces.title, count(pplaces.title), max (pplaces.id) as pleaides_id,
ST_AsGeoJSON(ST_Transform(max(pplaces.the_geom), 3857)) as geom
from pplaces
JOIN
tbib_pleiades
ON
pplaces.id = tbib_pleiades.pleiades_id
JOIN
tbib_network
ON
tbib_pleiades.verse = tbib_network.reference
where
character_1 = '$pidParam' or character_2 = '$pidParam'
GROUP BY
pplaces.title";

We are interested in every occurrence of an individual, so we do not care if the person is the target or the source. Our tbib_network table is exactly the same as the table used to build our Gephi network, and all people are assigned a unique ID that remains consistent across tables.

At the end of the .php file, all of the results are returned in json format:

//make a geojson object
while($row =pg_fetch_assoc($qry_result)){
//resize for map
$sizeForMap = (($row[count] / 10) + 1);

//arrange for map
$arr[] = array(
"type" => "Feature",
"geometry" => json_decode($row[geom]),
"properties" => array(
 "title" =>$row[title],
 "count" =>$sizeForMap,
 "pid" => $row[pleaides_id]
 ),
);
}
//encode into geojson
$geojson = '{"type":"FeatureCollection","features":'.json_encode($arr).'}';
echo $geojson;
?>

In the future, this database work will be mirrored by static json files, to allow for the easy export / import of BAM material.

When the PHP file returns a json string, the function then pulls it apart, creates new OpenLayers features, and then adds them to the map:

 success:function(dataJson) {
 for (var i = 0; i < dataJson.features.length; i++){
 var untransformed_feature = geojson_format.read(dataJson, "FeatureCollection");
 for (var j = 0; j < dataJson.features.length; j++){
 if (tBibfeaturesOnMap.indexOf(untransformed_feature[j].attributes.pid) < 0){
 tBibPeoplelayer.addFeatures(untransformed_feature[j]);
 tBibfeaturesOnMap.push(untransformed_feature[j].attributes.pid);
}
}
 tBibPeoplelayer.refresh({force:true}); 
 }
 },

The result is a layer that changes depending on what person is clicked.

A user selected popup

That is great for changing the map, but what about changing the nodes on the network graph for when an individual is selected on the map?

As we are displaying people names, not ID as clickable information in our popups, we need a way to translate the names to the IDs used by SigmaJs. This is simply a trivial php script that looks up an ID from a name table. Once the ID is returned, we simply activate the node with a call to the nodeActive function that we extended earlier and to our tBibPersonConnections function.

First, however, we have to listen for the event where the popup on the map is clicked:


//this is the popup listner

$('#popupSnagTable tbody').on( 'click', 'td', function () {
//now to start stripping out to what we need
var columnName = $('#popupSnagTable thead tr th').eq($(this).index()).html().trim();
if (columnName == 'Reference')

{
var ActiveRef = $(this).html().trim();
ActiveRef = ActiveRef.replace('Lk ','');
var ActiveRefSpilt = ActiveRef.split(":");
activeChapter = ActiveRefSpilt[0];
activeVerse = ActiveRefSpilt[1];
getPerseusText($(this).html().trim(), 0);
}
//if the user clicks on a name, then we use this to make an ajax call
if ((columnName == 'Entity 1') || (columnName == 'Entity 2')){
var personNameChoice = $(this).html().trim();

var dataString = 'pid='+personNameChoice;

$.ajax( { type:'GET', data:dataString, url:'bamIdFromNum.php', success:function(data2)

{

//from the sigma.js gephi instance

nodeActive(data2);

//now to add all of the places the entity is on the map. Searching by ID

tBibPersonConnections(data2, tBibPeoplelayer);

}

});

That is all there is to it – just a few listeners and a variable or two. There may be more efficient ways of doing this, but all the components are talking to each other!