Category Archives: BAM

Reflections on the BAM Conference

BAM2016_FinalI had the absolute privilege of attending the Big Ancient Mediterranean Conference (#BAM2016) this week. The remarkable projects, enthusiasm for all things digital, and congenial atmosphere was inspiring. Now that the conference has ended, I think it is a good time to organize my thoughts, and perhaps point out some of the common themes that particularly struck me.

1) Our projects are ready talk to each other. This was one of the most exciting revelations of the conference. Many of the digital humanities projects and initiatives represented here not only offer their data in downloadable format (.csv files, JSON dumps, etc), but also feature feature-rich APIs. Even if we are not quite yet to the point where we are using the same meta-data / data standards (more on that later), the use of APIs with permanent URIs allows our data sets to meaningfully interact. The work of Pelagios creates an excellent medium to facilitate such communication, and opens up our data to initiatives that are not limited to studies of the ancient world.

2) Users, users, users, users. We had some spirited and fascinating debate about who the audience is for digital humanities projects, and if it is even possible to create an application that can be effectively used by different audiences (experts, the general public, grad students, etc). I fall squarely on the side of the idea that we engage with multiple audiences by the very nature of a freely-accessible online platform, but our debate revealed a fundamental design question that is often not explicitly addressed: Exactly *who* is a digital humanities project for? Although I may differ with the voices questioning the multi-audience approach, I certainly agree with the position that we need increased usability studies and more robust user information. It is not enough for us to create DH projects that answer our individual questions for ourselves – we need to understand how to communicate with an audience which is used to the visual literacies of web and is less familiar with the conventions of scholarly communication derived from a print medium. The sample edition of Calpurnius from the Digital Latin Library (http://digitallatin.github.io/viewer/editio-2.0.html) is a great model – it captures the information of a textual apparatus free of technical jargon, rendering critical information to a wider audience without a loss of scholarly rigor.

3) Uncertainty. A corollary to the discussion around users is the question of representing uncertainty. There was an interesting question of why we should recognize fuzzy data at all: if an application is directed solely at an academic audience, is it not correct to assume that our users implicitly know that any data or representation of the ancient world is somewhat problematic, and therefore have no problem consuming visual representations that ignore the idea of uncertainty entirely? As I think that our projects need to communicate with non-academic audiences (and indeed academics who may not be as familiar with the inherent uncertainty of the ancient world), I see a very real need to represent the imprecision and uncertainty of our data. Almost all of the projects at BAM grappled with fuzzy data, whether that was geo-spatial (location, assignment to a place), textual (uncertain letter forms, unclear manuscript tradition), or interpretive (multiple archaeological reconstructions, the placement of garrison soldiers at a specific community). Almost every project dealt with uncertainty in a way that reflected the scholarly tradition of their subject area, like placing notes in an apparatus, or describing fuzzy data through text. I see a critical need to establish a common meta-data vocabulary that can, at the very least, alert users (both human and computational) to the presence of uncertainty in our work. I also see room for a common visual literacy for representing uncertainty in maps, social networks, or other visualizations, which is a far more complex issue.

4) Metadata and documentation. For example, even if it proves impossible / impractical / or undesirable to create a common visual literacy surrounding uncertainty, we need to implement a common way of indicating and describing fuzzy data that can be computationally consumed. This returns to my first point: our projects can now talk to each other through computational agents, but we must agree on the vocabulary governing that conversation. Alignment with Pelagios will help in that regard, but I think more attention needs to be paid at all levels of DH projects to metadata standards. For DH projects in the ancient world, the ontology for Linked Ancient World Data offered by LAWD (https://github.com/lawdi/LAWD) should be a staring point.

Much like the slow, often tedious process of generating metadata, creating documentation for DH projects is often overlooked. From comments in code to capturing the design decisions and the entire creative process, DH documentation needs to go beyond the narrative of the research question and capture the entire creative, intellectual, and industrial process of a DH project. The suggestion to look to the hard sciences foe guidance in this process is a fruitful place to start.

5) The use of open-source repositories and the continued importance of institutional support. Most of the projects at BAM had a presence at GitHub, and there was some very interesting discussion around the practicality and usefulness of a non-profit, academically oriented alternative. This debate had as a background the reality that GitHub and other free services are currently a critical component of our work, as many DH projects operate on a shoe-string budget and are dependent on largess from an institution or grants. Such funding is often uncertain; Pleaides, one of the most exemplary projects at BAM, has a 50% success rate at securing NEH funding. For smaller projects this rate may be even lower; some participants indicated that the reward to work ratio of grant applications is not attractive for smaller projects.

There is some good news though, as many institutions have expressed growing interest in the digital humanities as a field. As a digital humanities community we need to build on this interest with a push for institutional backing. The University of Iowa clearly demonstrated the excellent outcomes of a group that is both dedicated to digital humanities and able to provide hosting, archiving, and other technical support.

6) The continued need for face-to-face gatherings. While we have many electronic forums for communication (Twitter, Slack, IRC, site forums, etc), there is still something special that happens when DH scholars are brought together for several days, freed of other distractions, and think about the same issues as a group. For me, the headspace of a conference is entirely different than using Skype in my office; my other projects and papers are out of sight, (largely) out of mind, and my focus is squarely on the discussion.

7) Release the tweets. One place where documentation is somewhat overlooked is at conferences like BAM. Many conferences generate an end-product like proceedings, which while valuable, can not capture the conversation that surrounds each presentation. The incredible use of twitter by BAM attendees, and the use of storify to capture those tweets, can serve as a model for other conference proceedings. Conference organizers should establish an “official” twitter tag, advertise it widely on social media, and ensure that a conference venue offers free wifi-access to the attendees. This expands out the reach of the conference in real-time to attendees and remote presenters who would otherwise be unable to participate in the conversation. A critical component to this is also archiving – for BAM, the use of storify (part 1, part 2) and the support of Iowa libraries ensures that there is a searchable account that can be referenced of the conference and the wider conversation it sparked.

The BAM conference generated a lot of intriguing conversation and displayed a host of excellent projects. If this kind of interest, scholarship, and congeniality can be maintained, the future of DH is bright indeed.

1 of N: Gephi, D3.js, and maps

Update (11/12/15): See this post to integrate the following code with leaflet.

After finding no real way to use background maps with SigmaJs, I stumbled on this example of combining leaflet with D3.jshttp://bost.ocks.org/mike/leaflet/. The example is more closely aligned with what I want to achieve, which is using a display library to show a social network that respects / interacts with underlying geography. This would be a very valuable visualization for both TBib/BAM and my own work on garrisons, and completing it will allow me to get back to other tasks, like pounding out Greek inscriptions.

For this work I am not tied to Gephi, but I do like its interface and low learning curve, which is valuable for pedagogical and collaborative use. So, my first order of business is getting a Gephi project to talk nicely with D3.js. There is, of course, a nice example already in the wild: http://bl.ocks.org/susielu/9526340. However, this presented some serious problems, which I will outline to (hopefully!) help others who may be going down this path. So, refer back to http://bl.ocks.org/susielu/9526340 for the code template – what follows below are additions / modifications.

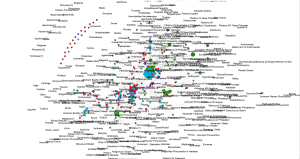
geo-attemprFor this project, I want to recreate the image to the right, which was created in Gephi. If you read my previous post on this topic, this image uses a geo-layout plugin to place locations from Pleiades in their correct geographic placement, then uses other layouts to place the people and other non locatable nodes. The eventual goal is to make an interactive network map above an interactive geographic map, so simply exporting these out as a flat svg file will not provide the functionality I need.

My first attempt to simply plug in my own data met with disaster. First, I got hit with an “Uncaught TypeError: Cannot read property ‘weight’ of undefined” error and absolutely no graph. Looking into it, I noticed that the example assumed that nodes would be referenced by their position in an index, NOT by their own id.


 var links = json.edges.map(function(d){
 return {
 'source': parseInt(d.source),
 'target': parseInt(d.target)
 }
 })

My linkages use a unique ID text attribute, which plays havoc with this function. However, this seems like a simple fix: simply remove the parseInt() function, and the actual linkages should work.


var links = json.edges.map(function(d){
 return {
 'source': d.source,
 'target': d.target
 }
 })

netminusnetGetting closer: I see a network graph….only minus the network. Yikes. So, what is going wrong?

It seems that linking nodes by attribute instead of index is a somewhat common problem in D3.js, with a good solution here: http://stackoverflow.com/questions/23986466/d3-force-layout-linking-nodes-by-name-instead-of-index. Following this example, I modified my code by adding the following:


var edges = [];
links.forEach(function(e) {
// Get the source and target nodes
var sourceNode = nodes.filter(function(n) { return n.id === e.source; })[0],
targetNode = nodes.filter(function(n) { return n.id === e.target; })[0];

// Add the edge to the array
edges.push({source: sourceNode, target: targetNode});
});

...

var force = d3.layout.force()
.nodes(nodes)
.links(edges)

...

var link = svg.selectAll(".link")
.data(edges)

workingFinally, the links show! The nodes, however, are of a uniform size. I want the nodes to reflect their size in Gephi. Luckily this was an easy fix: adding


.attr("r", function(d) { return d.size * 3; })

to

 node.append("svg:circle") 

did the trick. I also wanted to add colors from Gephi – the following code does so (with a conversion from RGB to hex provided by http://stackoverflow.com/questions/13070054/convert-rgb-strings-to-hex-in-javascript) :


var a = d.color.split("(")[1].split(")")[0];
a = a.split(",");

var b = a.map(function(x){ //For each array element
 x = parseInt(x).toString(16); //Convert to a base16 string
 return (x.length==1) ? "0"+x : x; //Add zero if we get only one character
})

b = "#"+b.join("");

 
 return {
 'id' : d.id,
 'x' : d.x,
 'y' : d.y,
 'fixed': true,
 'label' : d.label,
 'size' : d.size,
 'color' : b,
 }
 
 })

and


.style("fill", function (d) { return d.color; })

added to


node.append("svg:circle")

onemoreproblemThis produces a graph that looks correct except for one MAJOR problem: It seems the Y axis is inverted from the original! This is obviously not acceptable if I am trying to capture actual coordinates for a map. All is not lost: I do remember this being a problem in the SigmaJS exporter. A fix is provided here: https://github.com/oxfordinternetinstitute/gephi-plugins/issues/5#issuecomment-22291683. For me, this was as simple as adding the following code:


finalY = -d.y;
return {
'id' : d.id,
'x' : d.x,
'y' : finalY,
'fixed': true,
'label' : d.label,
'size' : d.size,
'color' : b,
}

})

to the

  var nodes = json.nodes.map(function(d)

block.

inorderThe next task will be to finalize some functionality for the D3.js portion of the graph, then on to integrating the whole mess with leaflet. Then, when I have all of this in order, time to re-write it to accept all manner of different inputs / etc for BAM. More on both of these ideas later.

Code for BAM: Part 1 of N. Gephi and Maps

This is the first in a series of posts where I will be detailing some of the code and development of BAM. Some of these techniques may be old hat for some users or simple hacks, but they might be useful for anyone else who is trying to do similar work.

TBib-select
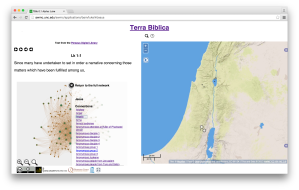
Terra Biblica with both the social network graph and map displaying information on Jesus.

In this post, I will detail how I got Gephi data (produced by the SigmaJs Exporter) to communicate with an OpenLayers 2 map. When a user clicks on any entity in the network graph the map panel will adjust to show the locations and frequency of that entity in geographic space. At the same time, any clicks on an entity name on the map (provided by a popup) will adjust the social network graph to highlight that entity. This code is built on javascript, PHP, and a PoistGIS backend. At some point in the future BAM may transition to OpenLayers 3, but for now we are sticking with 2 as it formed the basis for À-la-Carte, Digital Strabo, and other digital efforts that BAM builds upon and extends.

For a working demonstration of the final result, see http://awmc.unc.edu/awmc/applications/bam/luke/. All of the code mentioned in this post, and created for BAM, is available at: https://github.com/Big-Ancient-Mediterranean/BAM.

Step 1: Get your data in order!

Before attempting any of this, you need to ensure that the entities that you are using in Gephi and the ones you have in your database have a consistent, unique ID. So, if Andrew has an id of 1234567 in Gephi, you need to associate 1234567 with different locations, texts, etc in your database that are also related to Andrew. Failure to do so will make it VERY difficult, if not impossible, to get all of the different components to talk to each other.

Next, you actually need to build your network in Gephi and export it out. Building the network itself is beyond the scope of this post, but you need to install and familiarize yourself with the excellent SigmaJs Exporter created by Scott Hale at the Oxford Internet Institute. Essentially what we are doing is taking the output of the SigmaJs Exporter, cutting it down, and making it communicate with a dynamic, interactive map on the same webpage.

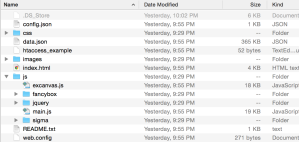
directoryAfter exporting your network using the SigmaJs Exporter, you should have a directory structure that roughly looks like the screenshot to the right. You want to upload everything but htaccess_exampleweb.config, and index.html to your webserver.

We then need to add this network to an HTML file that already has a map. In our case, we are modifying the code behind Strabo Online and SNAGG. I may detail how to create a map in another post, but there are plenty of resources online to get you going on a basic map.

We are going to mimic the functionality of the index.html file that we excluded in our own html file. First, we need to include the various javascript files and libraries used by the application:


<script src="js/jquery/jquery.min.js" type="text/javascript"></script>
<script src="js/sigma/sigma.min.js" type="text/javascript" language="javascript"></script>
<script src="js/sigma/sigma.parseJson.js" type="text/javascript" language="javascript"></script>
<script src="js/fancybox/jquery.fancybox.pack.js" type="text/javascript" language="javascript"></script>
<script src="js/main.js" type="text/javascript" language="javascript"></script>

<link rel="stylesheet" type="text/css" href="js/fancybox/jquery.fancybox.css"/>
<link rel="stylesheet" href="css/style.css" type="text/css" media="screen" />
<link rel="stylesheet" media="screen and (max-height: 770px)" href="css/tablet.css" />

Now we need to place some divs to hold the content from our social network. These can be styled at your leisure.


<div style="padding-left: 1%;padding-right: 1%;" id="socialNetContainer" class="socialNetContainer">

<div class="sigma-parent">

<div class="sigma-expand" id="sigma-canvas">

<div style="z-index:9994" id="attributepane">

<div class="text">

<div title="Close" class="left-close returntext">

<div class="c cf">
<span>Return to the full network</span>
</div>

</div>


<div class="nodeattributes">

<div class="name"></div>


<div class="data"></div>


<div class="p">Connections:</div>


<div class="link">

<ul>
</ul>

</div>

</div>

</div>

</div>

</div>

</div>

</div>


Now that we have all the functionality of the SigmaJs Exporter in our map, we need to make the components talk to each other. First, we need to identify what node is active on the sigma.js div, and use that information to select the appropriate data for our map. The function nodeActive in SigmaJs identifies what / when a node is active – so we will extend this to pass that information to a variable (for a more detailed explanation on how to extend a javascript function, see http://coreymaynard.com/blog/extending-a-javascript-function/).

We are also going to create a separate function to deal with adjusting the map itself, called tBibPersonConnections, which will be called in our new, extended function:

(function() {
//first copy the old function in the new one
 var old_nodeActive = nodeActive;

//new function with the same name as the old one - this overrides the old function
 nodeActive = function() {

//we are going to build the map from the person_id that is called from the node
// this is a separate function that will be explained below 
 tBibPersonConnections(arguments[0], tBibPeoplelayer);
 activePerson = arguments[0];

// Calls the original function\
 var result = old_nodeActive.apply(this, arguments);

// now return the result
 return result;
 }
})();

tBibPersonConnections is where the work really happens. Lets examine this function slowly.


function tBibPersonConnections(personNameChoice, tBibPeoplelayer)
{
 var dataStringForFeature ='pid=' +personNameChoice +'&amp;amp;amp;amp;amp;amp;start=0';
 tBibPeoplelayer.destroyFeatures();
 tBibfeaturesOnMap =[];

 $.ajax({
 dataType: "json",
 type:'GET',
 data:dataStringForFeature,
 url:'tbib_mapmaker.php',
 success:function(dataJson) {
 for (var i = 0; i &amp;amp;amp;amp;amp;lt; dataJson.features.length; i++){
 var untransformed_feature = geojson_format.read(dataJson, "FeatureCollection");
 //for some reason this is going into an array. Going to hardcode for now
 for (var j = 0; j &amp;amp;amp;amp;amp;lt; dataJson.features.length; j++){
 if (tBibfeaturesOnMap.indexOf(untransformed_feature[j].attributes.pid) &amp;amp;amp;amp;amp;lt; 0){
 tBibPeoplelayer.addFeatures(untransformed_feature[j]);
 tBibfeaturesOnMap.push(untransformed_feature[j].attributes.pid);
}
}
 tBibPeoplelayer.refresh({force:true}); 
 }
 },
 error: function (xhr, ajaxOptions, thrownError) {
 alert(xhr.responseText);
 }
 });

}

The function takes the ID of the person selected and layer that houses all of the feature information as arguments.

The first thing we do is create parameters for the PHP file that will return all of the place / feature information that is associated with an individual person. Do not worry about the “start” parameter for now, as it is only used when resetting the map to an initial state. The lines

tBibPeoplelayer.destroyFeatures();
tBibfeaturesOnMap =[];

first clear the map layer of all features, and then sets up an array to hold all of the new features that we will be adding to the map.

The AJAX call to tbib_mapmaker.php actually queries our database, and returns each feature that is associated with an individual, the number of times the individual is mentioned with the feature, and the geographic location of the feature. While the actual sql calls are specific to this application / database, I will show what we are doing for combining Pleiades data, BAM data, and the map:

$query = "select
pplaces.title, count(pplaces.title), max (pplaces.id) as pleaides_id,
ST_AsGeoJSON(ST_Transform(max(pplaces.the_geom), 3857)) as geom
from pplaces
JOIN
tbib_pleiades
ON
pplaces.id = tbib_pleiades.pleiades_id
JOIN
tbib_network
ON
tbib_pleiades.verse = tbib_network.reference
where
character_1 = '$pidParam' or character_2 = '$pidParam'
GROUP BY
pplaces.title";

We are interested in every occurrence of an individual, so we do not care if the person is the target or the source. Our tbib_network table is exactly the same as the table used to build our Gephi network, and all people are assigned a unique ID that remains consistent across tables.

At the end of the .php file, all of the results are returned in json format:

//make a geojson object
while($row =pg_fetch_assoc($qry_result)){
//resize for map
$sizeForMap = (($row[count] / 10) + 1);

//arrange for map
$arr[] = array(
"type" => "Feature",
"geometry" => json_decode($row[geom]),
"properties" => array(
 "title" =>$row[title],
 "count" =>$sizeForMap,
 "pid" => $row[pleaides_id]
 ),
);
}
//encode into geojson
$geojson = '{"type":"FeatureCollection","features":'.json_encode($arr).'}';
echo $geojson;
?>

In the future, this database work will be mirrored by static json files, to allow for the easy export / import of BAM material.

When the PHP file returns a json string, the function then pulls it apart, creates new OpenLayers features, and then adds them to the map:

 success:function(dataJson) {
 for (var i = 0; i < dataJson.features.length; i++){
 var untransformed_feature = geojson_format.read(dataJson, "FeatureCollection");
 for (var j = 0; j < dataJson.features.length; j++){
 if (tBibfeaturesOnMap.indexOf(untransformed_feature[j].attributes.pid) < 0){
 tBibPeoplelayer.addFeatures(untransformed_feature[j]);
 tBibfeaturesOnMap.push(untransformed_feature[j].attributes.pid);
}
}
 tBibPeoplelayer.refresh({force:true}); 
 }
 },

The result is a layer that changes depending on what person is clicked.

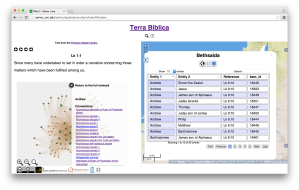
A user selected popup

That is great for changing the map, but what about changing the nodes on the network graph for when an individual is selected on the map?

As we are displaying people names, not ID as clickable information in our popups, we need a way to translate the names to the IDs used by SigmaJs. This is simply a trivial php script that looks up an ID from a name table. Once the ID is returned, we simply activate the node with a call to the nodeActive function that we extended earlier and to our tBibPersonConnections function.

First, however, we have to listen for the event where the popup on the map is clicked:


//this is the popup listner

$('#popupSnagTable tbody').on( 'click', 'td', function () {
//now to start stripping out to what we need
var columnName = $('#popupSnagTable thead tr th').eq($(this).index()).html().trim();
if (columnName == 'Reference')

{
var ActiveRef = $(this).html().trim();
ActiveRef = ActiveRef.replace('Lk ','');
var ActiveRefSpilt = ActiveRef.split(":");
activeChapter = ActiveRefSpilt[0];
activeVerse = ActiveRefSpilt[1];
getPerseusText($(this).html().trim(), 0);
}
//if the user clicks on a name, then we use this to make an ajax call
if ((columnName == 'Entity 1') || (columnName == 'Entity 2')){
var personNameChoice = $(this).html().trim();

var dataString = 'pid='+personNameChoice;

$.ajax( { type:'GET', data:dataString, url:'bamIdFromNum.php', success:function(data2)

{

//from the sigma.js gephi instance

nodeActive(data2);

//now to add all of the places the entity is on the map. Searching by ID

tBibPersonConnections(data2, tBibPeoplelayer);

}

});

That is all there is to it – just a few listeners and a variable or two. There may be more efficient ways of doing this, but all the components are talking to each other!